
Why Candlesticks Matter
Understanding the basics before diving into patterns
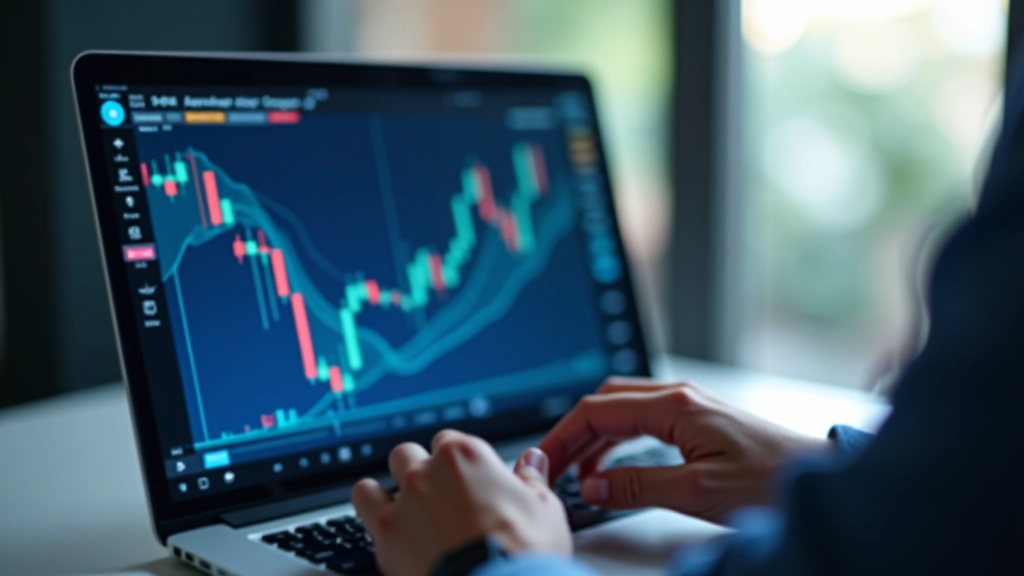
A candlestick isn't complicated. It's really just a picture of what happened during a specific time period — whether that's 5 minutes, an hour, or a day. The body shows the opening and closing price. The wicks show the highest and lowest prices traders hit during that time.
Here's the thing: you don't need to memorize 50 different patterns. Most traders focus on 6-8 that actually work. We're going to skip the obscure stuff and focus on what matters. A doji tells you something useful. A hammer tells you something useful. Everything else is just noise.
The real skill isn't recognizing the pattern — it's knowing what to do when you see it. That's where context matters. A hammer at the bottom of a downtrend is different from a hammer in the middle of nowhere.

The Patterns You'll Actually Use
Six essential formations to recognize
Doji
Open and close at roughly the same price. Means indecision. You'll see these at turning points.
Hammer
Small body at the top with a long wick below. Suggests a potential reversal, especially after a downtrend.
Engulfing
A larger candle completely covers the previous one. Bullish or bearish depending on direction.
Morning Star
Three candles: down, small gap, then up. It's a reversal signal at the bottom of downtrends.
Inside Bar
Candle completely inside the previous one's range. Suggests a breakout might be coming soon.
Pin Bar
Similar to a hammer or shooting star. Rejection of a price level. Useful at support and resistance.


Context Changes Everything
Pattern recognition without context is just pattern matching
Here's where most people go wrong. They see a hammer and think "reversal incoming." But what if that hammer appears in the middle of a strong uptrend? It's not a reversal signal anymore — it's just a minor pullback.
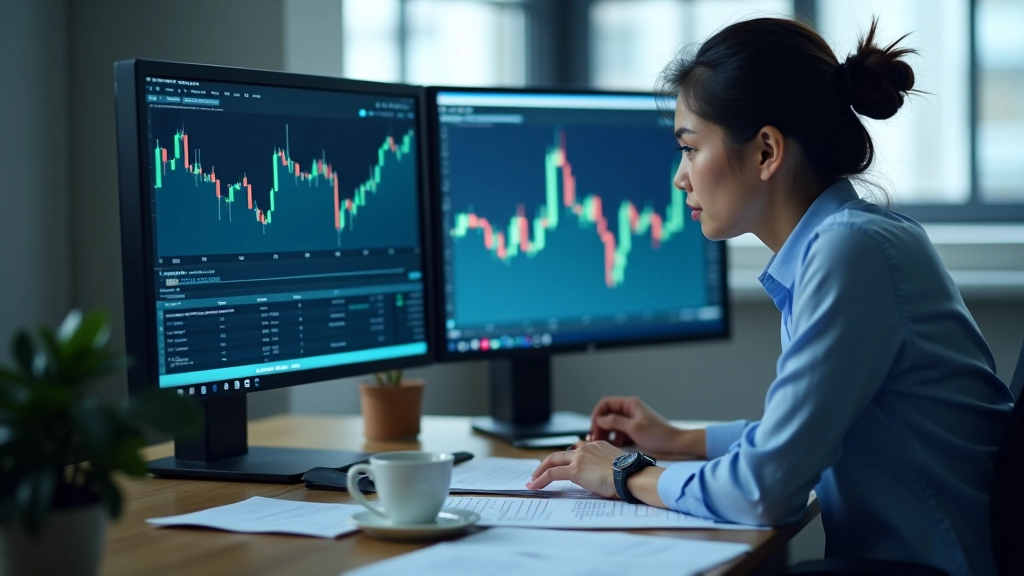
This is why we don't teach patterns in isolation. You need to know: Where are support and resistance levels? What's the overall trend? What does volume say? A doji at resistance means something different from a doji in the middle of nowhere.
Most traders spend weeks learning pattern names. Smart traders spend that time learning context. They ask: "Does this pattern make sense here?" That question matters more than perfect pattern recognition.
Practice Without Pressure
How to develop your pattern recognition skills

Don't try to learn all patterns at once. Pick two. Master them over the next month. That means seeing them in different timeframes, different markets, different contexts. Not just looking at them in textbooks.
Use historical charts. Find where the hammer appeared. Did it work? Why or why not? This is how you build real intuition, not just memorization.
Paper trading helps too. You'll start noticing patterns everywhere once you're looking for them. The key is looking with context, not just shape-matching. Over time, you'll develop a feel for which patterns actually signal something important versus which ones are just noise.
Moving Forward
Charts are just a language. Candlestick patterns are words in that language. But like any language, knowing the words isn't enough — you need context to understand what they mean.
Start with 6 patterns. Learn where they appear, what they mean, and when they actually matter. Skip the complex stuff. Build your foundation on solid ground. The advanced patterns will make sense once you understand the basics.
Next, we're moving into risk management and position sizing. That's where the real edge comes from. Patterns help you spot opportunities. But risk management is what keeps you in the game long enough to profit from them.
Educational Disclaimer
This article is educational material designed to help you understand technical analysis concepts and candlestick patterns. It's not financial advice, investment advice, or a recommendation to buy or sell any security.
Market analysis involves risk. Past performance doesn't guarantee future results. Before trading, understand the risks involved and consider consulting with a qualified financial advisor. Trading decisions should be based on your own research, risk tolerance, and financial situation.